TL;DR#
Built a DevOps Incident Investigator using Coral SQL that correlates GitHub PRs, Sentry incidents, and Slack incident context using a single SQL query.
Coral turns operational debugging into a single SQL query across distributed systems.
Results:
- 📉 Incident triage reduced from ~15 minutes to ~15 seconds.
- 🪸 Custom Coral source spec created for internal APIs.
- 🤖 AI-generated root cause analysis and Slack alerts.
- 💻 Includes both a CLI and a Web Dashboard.
Built in 4 days for the Pirates of the Coral-bean hackathon.
📖 The Story (what this tool does)#
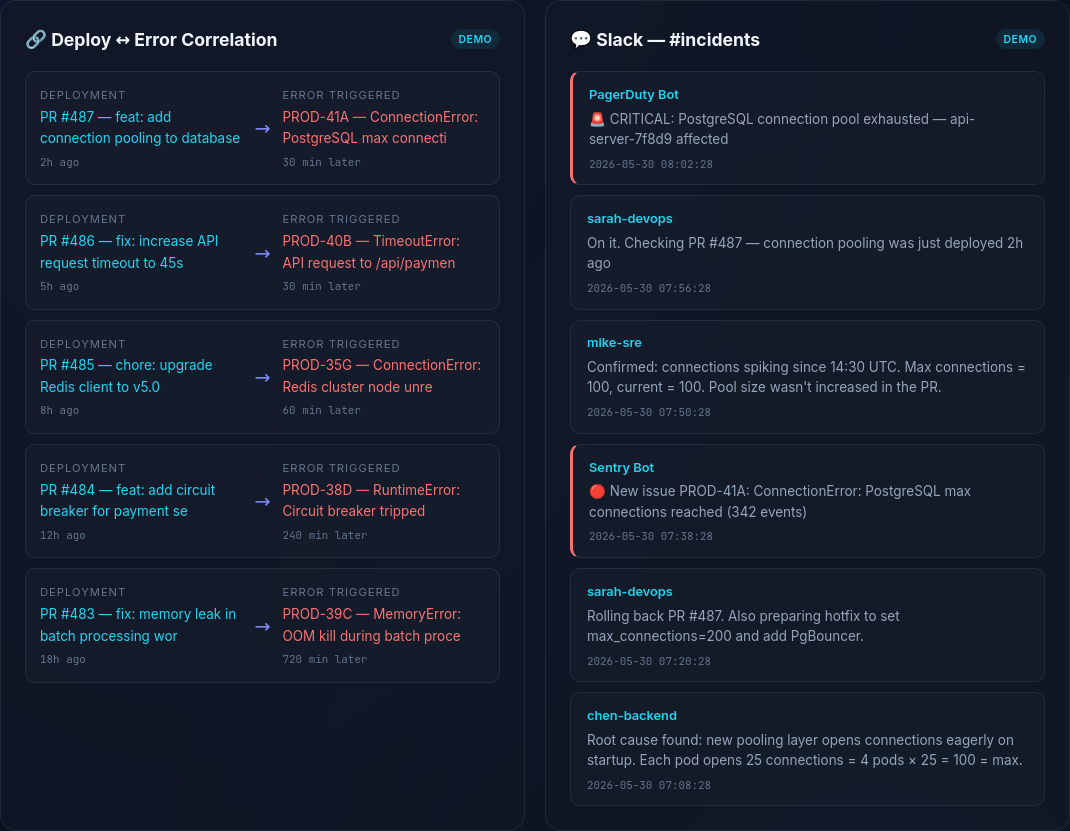
Imagine this: a developer merges a Pull Request on GitHub. That PR automatically shows up in the Incident Investigator dashboard under Deployments.
Minutes later, something breaks — a new error starts firing in Sentry. The tool instantly correlates that error back to the exact PR that caused it, showing you: “PR #42 was merged 15 minutes before this error first appeared.”
Now the on-call engineer clicks the incident → Gemini AI analyzes the root cause in seconds, gives immediate fix steps and long-term prevention advice.
One click on 📢 Send to Slack and the full incident report is posted to your team’s
#incidentschannel.And if you just want a quick answer? Type plain English like “Which errors have the most events?” → Gemini writes the Coral SQL → executes it live → shows you the results.
That’s the DevOps Incident Investigator — from PR merge to root cause to team notification, all in one tool powered by Coral SQL + Gemini AI.
The Problem#
As a DevOps engineer, I’ve experienced the pain of incident investigation firsthand — switching between GitHub, Sentry, and Slack at 2 AM trying to figure out what broke production.
- GitHub — “Which PR was deployed last?”
- Sentry — “What errors are spiking?”
- Slack — “What’s the team saying?”
That’s 3 tabs, 3 APIs, and 15 minutes of context-switching before you even understand what happened. This is what modern incident response looks like without unified observability.
The Solution#
When I discovered Coral, an open-source tool that lets you query any API with SQL, I knew exactly what to build.
One command. Three sources. Full incident picture.
python3 investigator.py --query all --owner khadirullah --repo demo-payment-apiThe Magic: Cross-Source JOINs#
Coral allows querying GitHub and Sentry together in a single statement. For this prototype, I use deployment timing to surface likely suspect PRs that were merged around the same time incidents first appeared.
SELECT p.number AS pr_number, p.title AS pr_title,
       p.user__login AS pr_author, p.merged_at,
       i.short_id AS sentry_id, i.title AS error_title,
       i.level AS error_level, i.first_seen AS error_first_seen
FROM github.pulls p
JOIN sentry.issues i ON p.merged_at IS NOT NULL
WHERE p.owner = 'khadirullah' AND p.repo = 'demo-payment-api'
  AND p.state = 'closed'
ORDER BY i.first_seen DESC, p.merged_at DESC LIMIT 15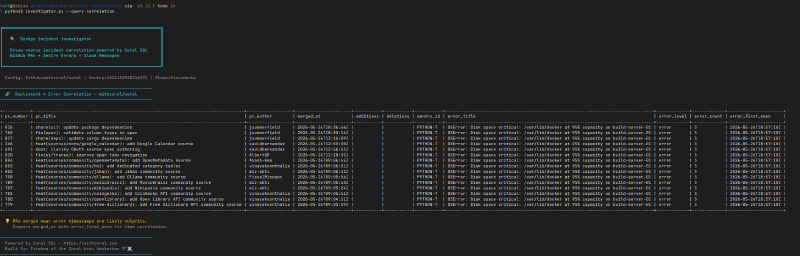
Why I Chose Coral (and Why It’s a Game-Changer)#
Normally, if you want to pull data from GitHub, Sentry, and Slack, you end up installing multiple SDKs (PyGithub, sentry-sdk, slack-sdk), learning different APIs, handling pagination and retries yourself, and writing glue code to correlate everything manually.
(Note: SDKs like sentry-sdk are excellent for emitting telemetry from applications, but they are still siloed when it comes to querying and correlating operational data across multiple platforms during an incident.)
What Coral Replaced#
flowchart TD
    subgraph "Before Coral"
        GH[GitHub SDK]
        S[Sentry SDK]
        SL[Slack SDK]
        GLUE[Custom Glue Code
+ Pagination
+ Rate Limiting]
        GH --> GLUE
        S --> GLUE
        SL --> GLUE
    end

    subgraph "After Coral"
        C[Coral SQL]
        Q[SELECT * FROM github
JOIN sentry
JOIN slack]
        C --> Q
    end
By treating the entire operational stack as a unified query layer, I was able to build my agent using far fewer SDKs and almost no glue code. Coral handles the authentication, pagination, and schema mapping locally, allowing me to focus on the actual business logic: writing cross-source JOINs and generating AI analysis.
Day 1: Setting Up Coral & Connecting Sources#
Installing Coral#
curl -fsSL https://withcoral.com/install.sh | sh
coral --version
# coral 0.3.0+96d61f7
One command. That’s it.
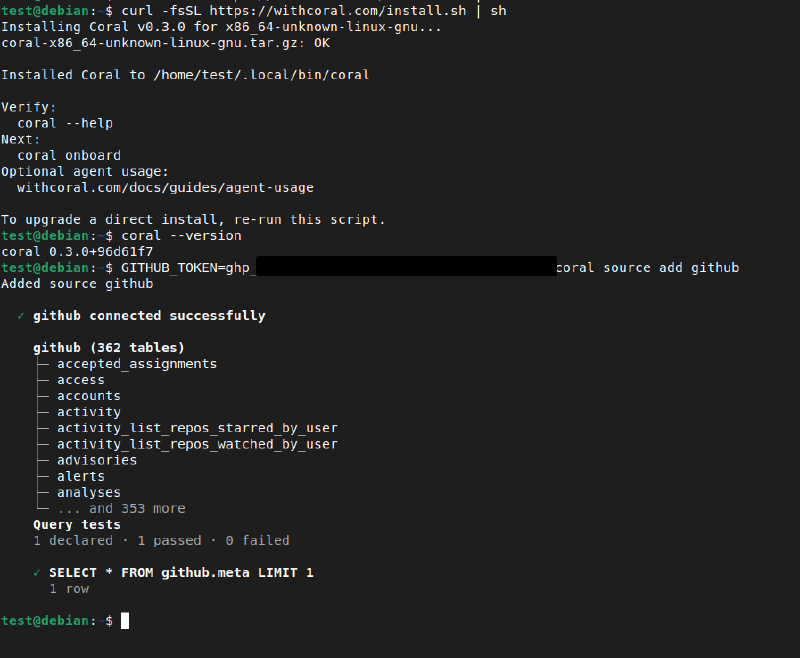
Connecting GitHub#
GITHUB_TOKEN=ghp_XXXXX coral source add github362 tables connected instantly — issues, pull requests, commits, repos, actions.
Connecting Sentry#
Finding the Sentry token wasn’t obvious. Sentry doesn’t have a simple “API Tokens” page — you create tokens through Custom Integrations:
- Settings → Custom Integrations → Create New Integration (Internal Integration)
- Name it
coral-hackathonwith minimal read-only permissions (Project: Read, Issue & Event: Read, Organization: Read):
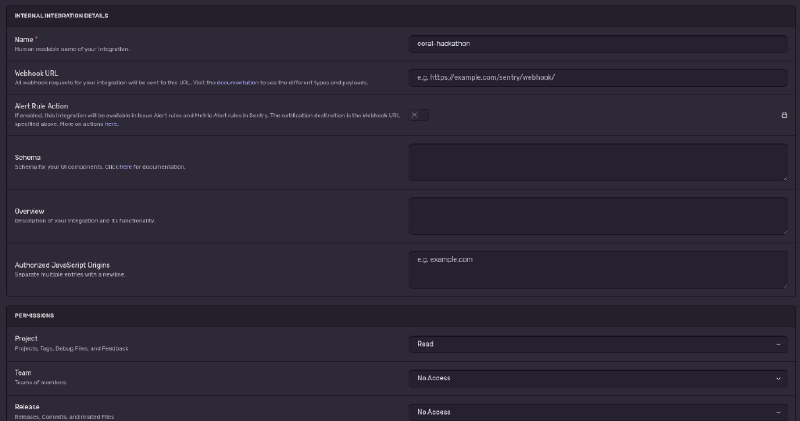
- Copy the generated token and connect:
SENTRY_TOKEN=sntrys_XXXXX SENTRY_ORG=my-org coral source add sentry12 tables connected — events, issues, projects, deployments.
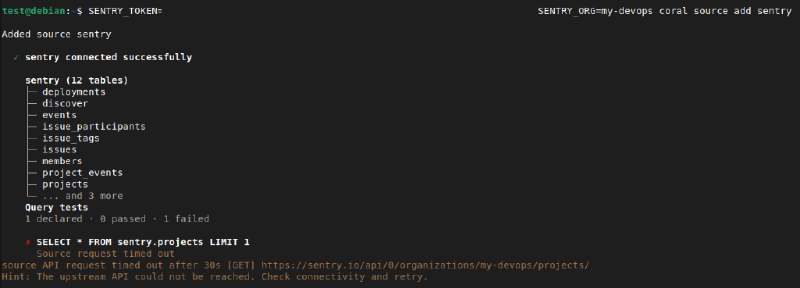
I verified the tables were available with a quick SELECT schema_name, table_name FROM coral.tables.
Connecting Slack#
Slack was the trickiest. Coral’s pre-filled link creates a Slack app, but it only sets up User Token Scopes with PKCE — tokens aren’t displayed in the UI.
channels:history, channels:read, groups:history, groups:read, users:read. Then reinstall the app — a Bot User OAuth Token (xoxb-...) appears!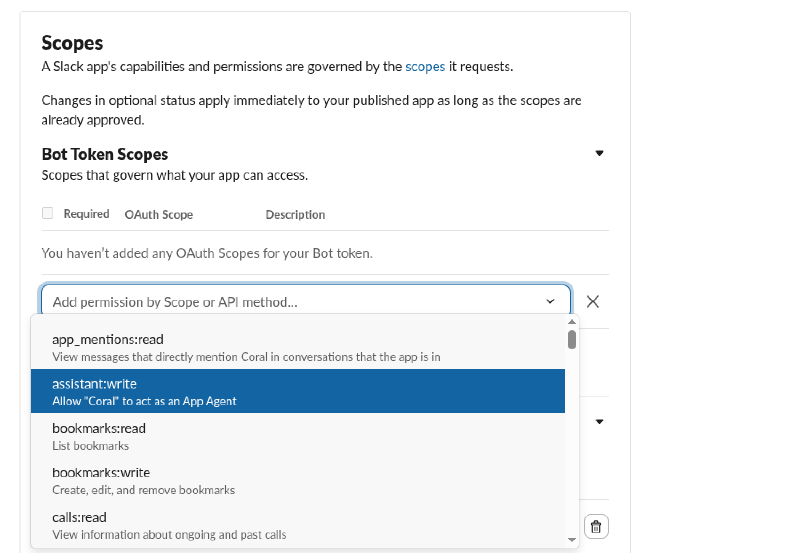
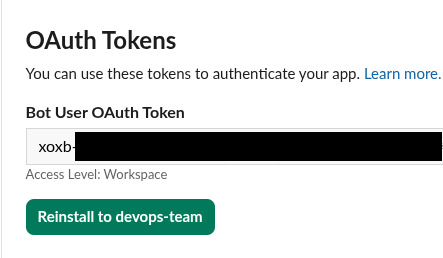
coral source add --interactive slack
# Paste xoxb-... token when prompted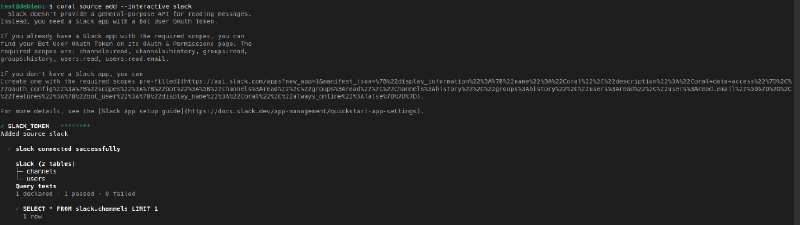
All Sources Connected! 🎉#
| Source | Tables | What It Gives Us |
|---|---|---|
| GitHub | 362 | PRs, commits, issues, actions |
| Sentry | 12 | Errors, events, projects |
| Slack | 2 | Channels, users |
| Total | 376 | All queryable with SQL |
Architecture#
Here’s how the entire system fits together:
graph TB
    subgraph "User Interfaces"
        CLI["🖥️ CLI
investigator.py"]
        WEB["🌐 Web Dashboard
Flask + Vanilla JS"]
    end

    subgraph "Backend - app.py"
        API["Flask API
15 endpoints"]
        SEC["🔒 Token Security
Symmetric encryption"]
        DEMO["📦 Demo Data
Pre-loaded scenarios"]
    end

    subgraph "AI Layer"
        GEMINI["🤖 Gemini Flash
Root Cause Analysis"]
        NL2SQL["💬 NL-to-SQL
Natural Language Queries"]
    end

    subgraph "Coral SQL Layer"
        CORAL["🪸 Coral CLI
coral sql"]
    end

    subgraph "Data Sources"
        GH["GitHub API
362 tables"]
        SENTRY["Sentry API
12 tables"]
        SLACK["Slack API
2 tables"]
        PAY["Payment API
Custom Source Spec"]
    end

    subgraph "Alerting"
        SLACKALERT["📢 Slack #incidents
Automated Alerts"]
    end

    CLI --> CORAL
    WEB --> API
    API --> CORAL
    API --> SEC
    API --> DEMO
    API --> GEMINI
    API --> NL2SQL
    NL2SQL --> CORAL
    CORAL --> GH
    CORAL --> SENTRY
    CORAL --> SLACK
    CORAL --> PAY
    GEMINI --> SLACKALERT
Two interfaces (CLI + Web Dashboard) sit on top of Coral SQL, which unifies 4 data sources into a single query layer. The AI layer uses Gemini Flash for root cause analysis and natural language → SQL generation.
Day 2: Writing SQL Queries & Building the CLI#
Generating Test Data for Sentry#
First roadblock: Sentry was empty. I wrote generate_errors.py to send 10 realistic DevOps errors:
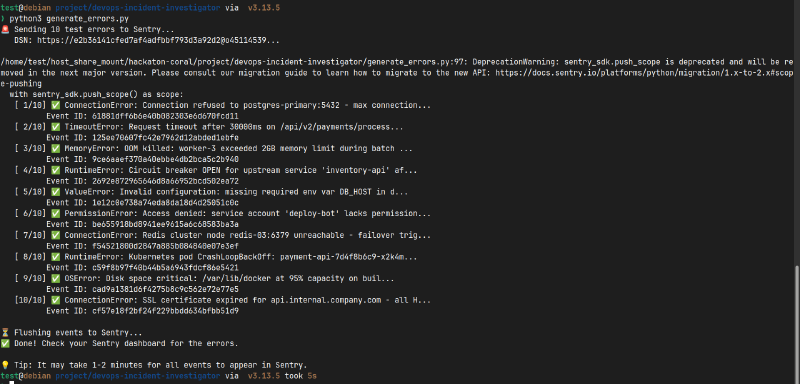
Errors include: ConnectionError (PostgreSQL max connections), MemoryError (OOM kill), RuntimeError (K8s CrashLoopBackOff), TimeoutError (30s timeout), and more.
The SQL Queries#
Query 1: Deployments — “What was recently deployed?”
SELECT number, title, user__login AS author, merged_at
FROM github.pulls
WHERE owner = 'khadirullah' AND repo = 'demo-payment-api'
  AND merged_at IS NOT NULL
ORDER BY merged_at DESC LIMIT 10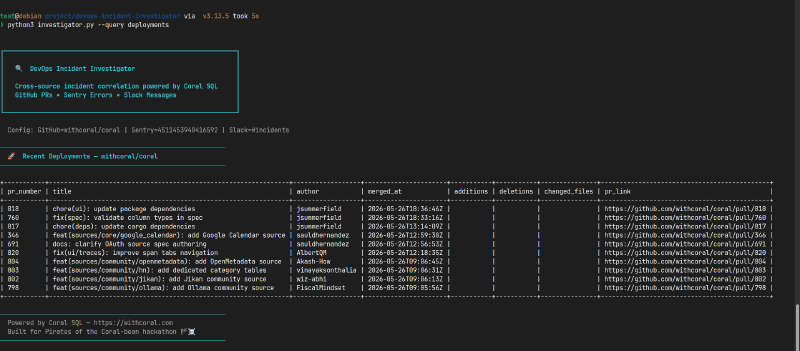
Query 2: Incidents — “What errors are happening?”
SELECT short_id, title, level, count AS event_count, first_seen, last_seen
FROM sentry.issues
ORDER BY last_seen DESC LIMIT 10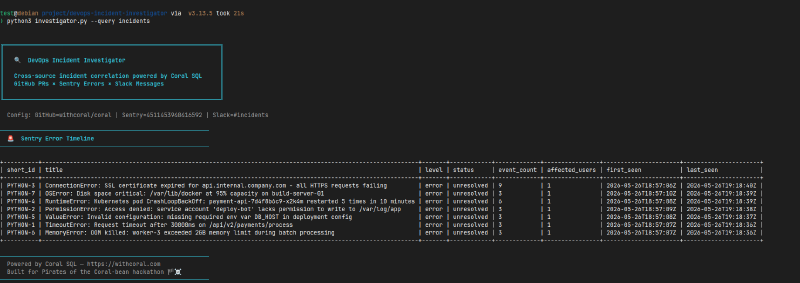
Query 3: Correlation — “Suspect deployment identification”
(As shown in the introduction, this cross-source JOIN correlates GitHub PRs with Sentry errors based on timestamps).
Query 4: Team Overview — Another cross-source JOIN:
SELECT u.name AS username, u.real_name, u.is_admin,
       c.name AS channel_name, c.num_members
FROM slack.users u CROSS JOIN slack.channels c
WHERE u.deleted = false AND c.is_archived = false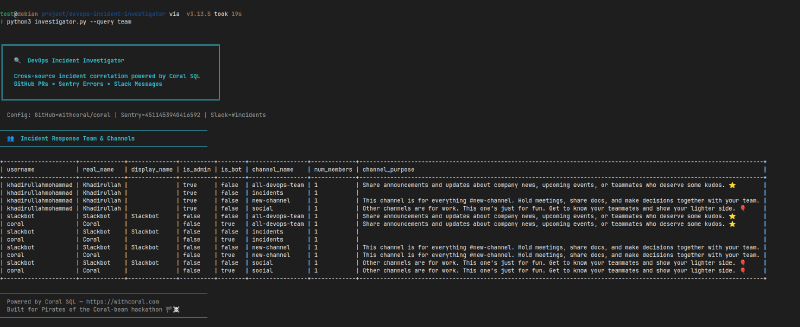
Building the CLI#
The CLI wraps everything in a clean, colorful interface with zero pip dependencies — Python stdlib only (subprocess, argparse, json, urllib):
python3 investigator.py --query all \
  --owner khadirullah --repo demo-payment-api \
  --slack-token $SLACK_TOKEN
Troubleshooting Gotchas#
Sentry Project ID: My first query failed with "Invalid project parameter. Values must be numbers." I was using the slug (python) but Sentry wants the numeric ID. Fixed with:
SELECT id, slug, name FROM sentry.projectsnot_in_channel error when fetching messages. The bot had channels:history but wasn’t in the channel. Then hit missing_scope — needed channels:join scope. Quick fix: add scope → reinstall app → copy new token.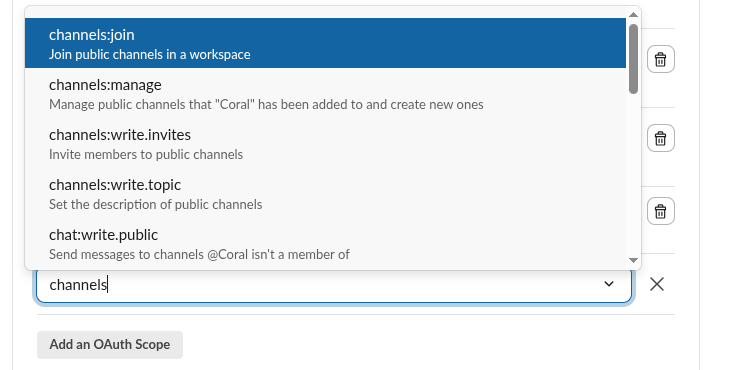
Day 3: Web Dashboard + AI Integration#
Why Build a Dashboard?#
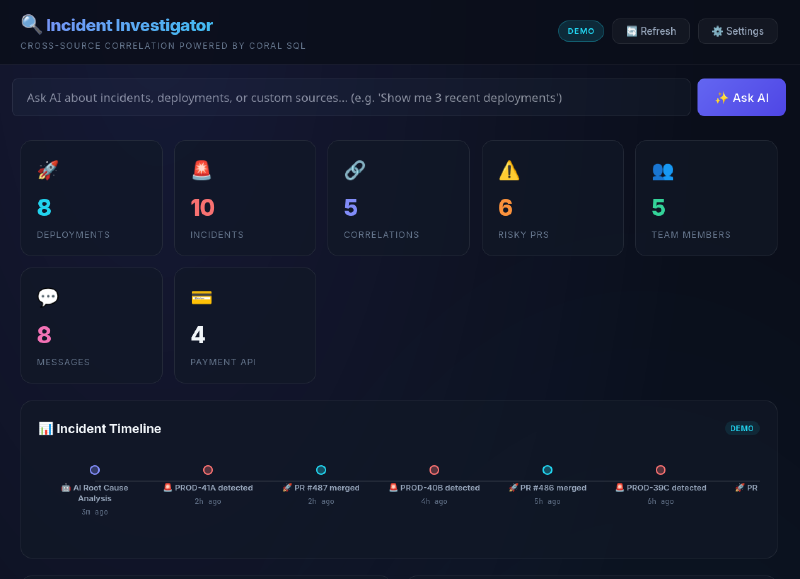
A CLI is functional, but judges have 5 minutes. They need to see the data. I built a Flask dashboard with a dark glassmorphism design.
The Dashboard#
Features:
- Stats Row — Live counters for deployments, incidents, correlations, risky PRs
- Incident Timeline — Horizontal scrolling event sequence
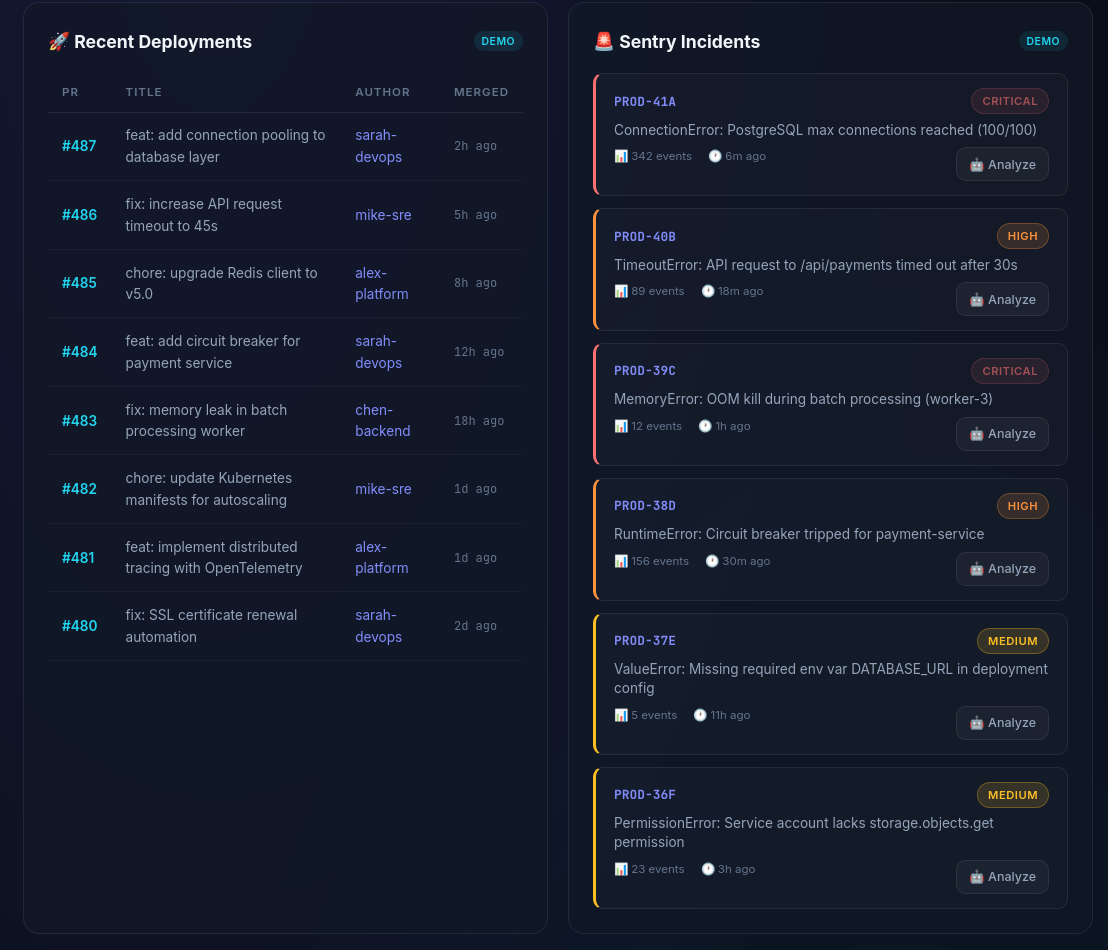
- Deployments Table — Merged PRs with authors and timestamps
- Sentry Incidents — Severity-colored cards with “🤖 Analyze” button
- Correlation View — Visual PR ↔ Error mapping
- Slack Messages — Chat-style from #incidents
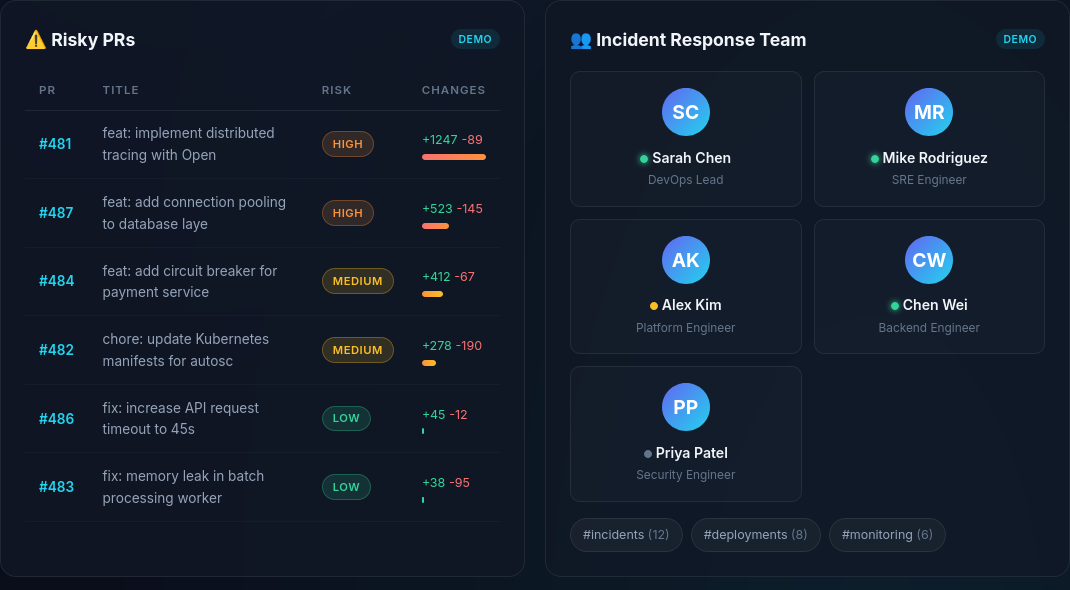
- Risky PRs — Risk-scored with green/yellow/red bars
- Team Overview — Member cards from Slack users × channels JOIN
AI Root Cause Analysis#
Click 🤖 Analyze on any Sentry error:
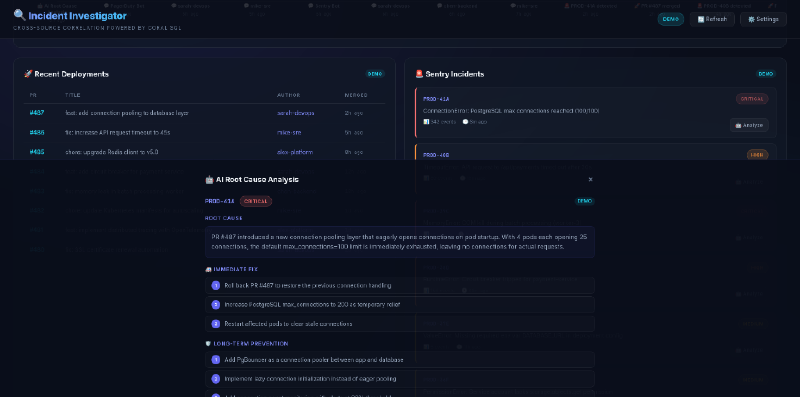
For example, PROD-41A (PostgreSQL max connections):
Root Cause: PR #487 introduced a new connection pooling layer that eagerly opens connections on pod startup. With 4 pods each opening 25 connections, the default max_connections=100 limit is immediately exhausted.
Immediate Fix: 1) Roll back PR #487, 2) Increase max_connections to 200, 3) Restart affected pods
Confidence: 94% (Coral system score)
(Note: This example is generated from demo data and illustrates the style of analysis produced by the assistant.)
In live mode with a Gemini API key, it calls Gemini Flash in real-time. Pre-computed demos ensure instant results without API waits.
Settings & Token Security#
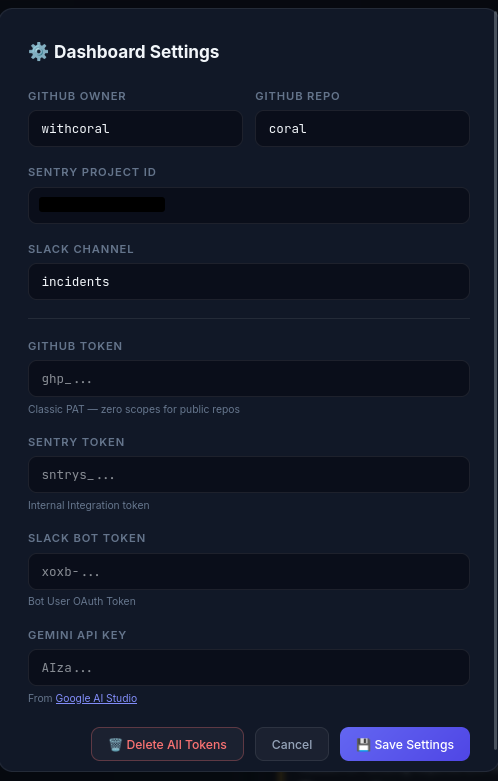
- All 4 API tokens encrypted with Fernet symmetric encryption before writing to disk
- “Delete All Tokens” does a 3-pass random overwrite
- Demo → Live toggle with per-panel badges
Demo Mode#
The dashboard starts in Demo Mode — pre-loaded data, zero setup. Switching to live is 4 clicks:
- ⚙️ Settings → enter tokens
- 💾 Save
- Click DEMO badge → LIVE
- 🔄 Refresh
If a live call fails, panels gracefully fall back to demo data.
Day 4: Competitive Upgrades — Going Beyond#
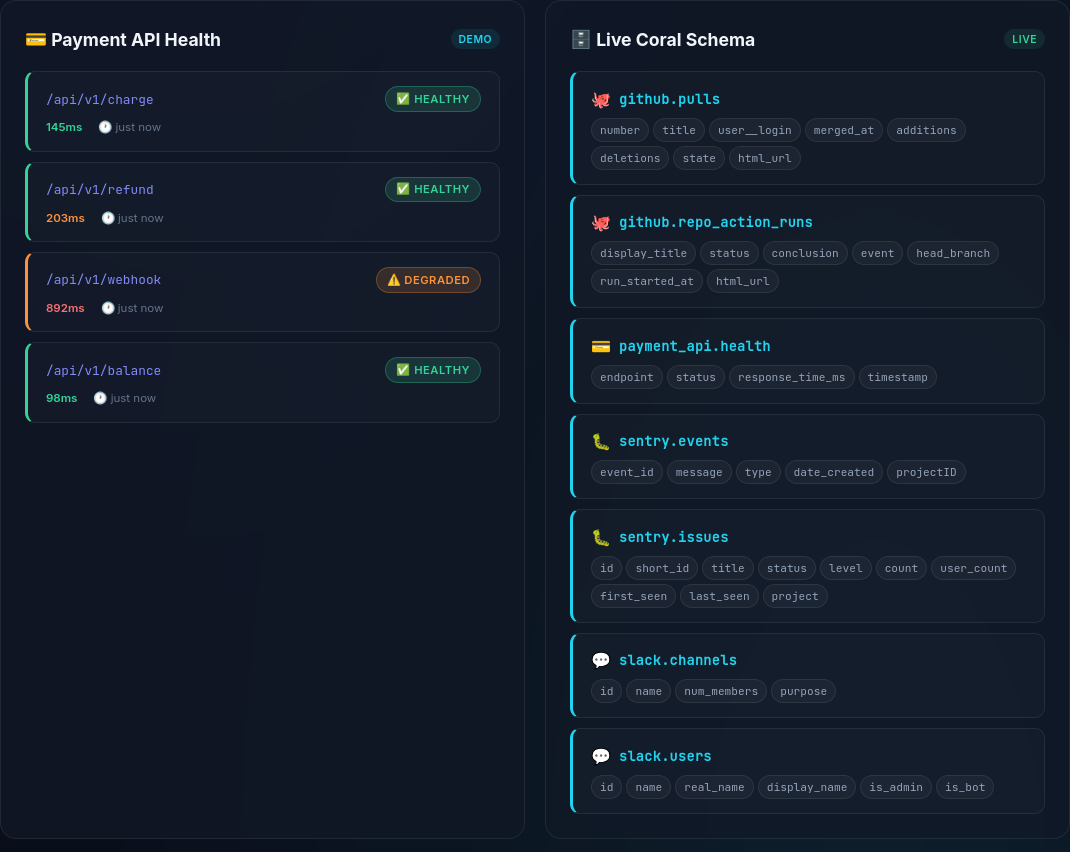
Custom Source Spec: Querying Internal APIs#
Enterprises don’t just use public SaaS tools. A real incident investigator needs to query internal microservices. This is where Coral’s Custom Source Specs shine.
I built a companion project (demo-payment-api) and wrote a YAML spec to teach Coral how to talk to it:
name: payment_api
version: 0.1.0
dsl_version: 3
backend: http
base_url: "http://localhost:5001"

auth:
  type: HeaderAuth
  headers:
    - name: Authorization
      template: "Bearer {{input.PAYMENT_API_TOKEN}}"

tables:
  - name: health
    request:
      method: GET
      path: /api/health
    columns:
      - name: status
        type: Utf8
        expr: { kind: path, path: [status] }
      - name: response_time_ms
        type: Int64
        expr: { kind: path, path: [response_time_ms] }
The YAML acts as a “translator” — it tells Coral how to map SQL concepts (tables, columns) to HTTP concepts (endpoints, JSON paths):
sequenceDiagram
    participant User
    participant Coral
    participant YAML as payment-api.yaml
    participant API as Payment API

    User->>Coral: SELECT status FROM payment_api.health
    Coral->>YAML: Look up "health" table
    YAML-->>Coral: GET /api/health
    Coral->>API: HTTP GET http://localhost:5001/api/health
    API-->>Coral: {"status": "healthy", "response_time_ms": 42}
    Coral-->>User: | status  | response_time_ms |
    Note over Coral,User: | healthy |       42         |
Register and query:
# Lint the spec
coral source lint coral-config/payment-api.yaml

# Add to Coral
PAYMENT_API_TOKEN=mock_123 coral source add --file coral-config/payment-api.yaml

# Query like a database!
coral sql "SELECT * FROM payment_api.health"Natural Language to SQL (/api/ask)#
Type a question in plain English → AI generates Coral SQL → executes it → returns results:
flowchart LR
    A["User: 'Show me critical
errors from last week'"] --> B["Gemini Flash"]
    B --> C["SELECT * FROM sentry.issues
WHERE level = 'error'
LIMIT 10"]
    C --> D["Coral SQL Engine"]
    D --> E["Results Table"]
The backend feeds the live Coral schema (all tables + columns) to Gemini, so it generates accurate SQL every time.
Automated Slack Alerts#
Investigation is only half the battle — communication is the other half. After AI generates a root cause analysis, users can click "📢 Send to Slack" to push the report directly to #incidents:
flowchart LR
    A["🚨 Sentry Error"] --> B["🤖 AI Analysis"]
    B --> C["📢 Send to Slack"]
    C --> D["#incidents channel"]
    D --> E["Team sees report"]
If the token only has read permissions, the UI catches the missing_scope error and gracefully prompts the user to add chat:write scope.
Handling Slack Messages (TVF vs Custom Fallback)#
Coral exposes Slack messages via a function-like table interface (TVF), which requires passing the exact channel ID directly into the SQL query: SELECT * FROM slack.messages(channel => 'C12345678').
However, I needed something more robust for an automated dashboard. If the bot isn’t already in the incident channel, the Slack API returns a strict not_in_channel error. Instead of failing, I deliberately built a custom Python fallback that catches this error, dynamically forces the bot to join the channel, fetches the messages, and then uses Coral to pull the slack.users table to map the raw User IDs (e.g., UXXXXXXX) to real human names.
Fetching the Team Overview#
With the messages handled resiliently, I still needed to display the active Incident Response team. Instead of making separate API calls for users and channels, I let Coral grab the entire team landscape in a single round-trip using a CROSS JOIN:
SELECT u.name AS username, u.real_name, u.is_admin,
       c.name AS channel_name, c.num_members
FROM slack.users u CROSS JOIN slack.channels c
WHERE u.deleted = false AND c.is_archived = false
A quick Python iteration separates the results, giving us the full team and channel rosters instantly without juggling multiple Slack SDK requests.
Why Sentry (Not Just SonarQube & Trivy)#
A question I got: “Why do you need Sentry if you have SonarQube and Trivy?” The answer:
flowchart LR
    subgraph "Before Deploy"
        SQ["SonarQube
'Code COULD break'"]
        TV["Trivy
'Has known CVEs'"]
    end
    subgraph "After Deploy"
        SE["Sentry
'App JUST broke
for 1,203 users'"]
    end
    SQ --> DEPLOY["Deploy"]
    TV --> DEPLOY
    DEPLOY --> SE
| Tool | Stage | Catches |
|---|---|---|
| SonarQube | Pre-deploy (CI) | Code smells, potential bugs |
| Trivy | Pre-deploy (CI) | Known CVEs in dependencies |
| Sentry | Post-deploy (Runtime) | Real crashes, right now, with stack traces + user impact |
The Incident Investigator bridges all three stages — correlating code changes (GitHub) with runtime errors (Sentry) and team communication (Slack).
Setting Up Slack Alerts (Webhooks vs Bot Tokens)#
We use both approaches:
| Feature | Incoming Webhook | Bot Token (xoxb-) |
|---|---|---|
| Direction | App → Slack (one-way) | App ↔ Slack (two-way) |
| Use case | Post alerts | Read messages + respond |
| Setup | Just a URL | OAuth scopes |
| Best for | Simple alerting | Complex integrations |
- Webhook → Demo Payment API posts error alerts to
#incidents - Bot Token → Incident Investigator reads messages from
#incidentsvia Coral SQL
The complete pipeline:
flowchart TB
    ERR["Error in Payment API"] --> SENTRY["Sentry captures exception"]
    ERR --> WEBHOOK["Slack webhook fires"]
    WEBHOOK --> INCIDENTS["#incidents channel"]
    SENTRY --> CORAL["Coral SQL queries"]
    INCIDENTS --> CORAL
    GH["GitHub PRs"] --> CORAL
    CORAL --> INVESTIGATOR["Incident Investigator"]
    INVESTIGATOR --> AI["Gemini AI Analysis"]
    AI --> ALERT["📢 Push to Slack"]
    ALERT --> INCIDENTS
What I Learned#
About Coral#
- Zero-scope GitHub tokens work — just bumps your rate limit for public repos
- Sentry wants numeric project IDs — not slugs, query
sentry.projectsfirst - Slack’s Coral source is limited — only
channelsandusers, no messages. But the bot token works with direct API calls - Cross-source JOINs are the killer feature — GitHub × Sentry in one SQL statement is genuinely powerful
About DevOps Incident Response#
The hardest part of incident response isn’t fixing the problem — it’s finding the right information. We spend more time context-switching than debugging. The investigator answers three questions fast:
- What was deployed recently?
- What errors appeared after deployment?
- What’s the team saying about it?
That’s 80% of the first 15 minutes of any incident.
About Hackathons#
- Ship fast, iterate later — the Discord advice was spot-on
- Document as you go — writing the blog alongside the code was more efficient
- Errors are content — every
missing_scopebecame a blog section - Keep scope tight, then expand — CLI first, dashboard second, AI third
Limitations#
- Correlation heuristic: GitHub ↔ Sentry correlation is currently based on deployment timing, not deterministic tracing.
- AI as an assistant: Root cause analysis is AI-assisted and should be treated as a hypothesis, not absolute truth.
- Slack capabilities: Slack messages are retrieved through a Python fallback integration because the native Coral Slack source currently exposes only users and channels.
- API rate limits: In a high-traffic live incident, direct API calls to Slack and GitHub could hit rate limits, requiring an intermediate caching layer.
- Schema mismatches: Edge cases in custom internal APIs may occasionally fail to map perfectly to Coral’s static YAML types without custom data coercions.
The Result#
In testing, the workflow reduced incident investigation from roughly 15 minutes of manual context-switching to less than 15 seconds for an initial deployment-to-error correlation query.
The Impact#
Before (The Old Way):
- ❌ Open GitHub to check recent PRs
- ❌ Open Sentry to check recent errors
- ❌ Open Slack to read team discussions
- ❌ Manually correlate timestamps across 3 tabs
After (The Coral Way):
- ✅ Run one command or view one dashboard
- ✅ Instantly see PRs and Errors side-by-side
- ✅ Get AI-generated root cause analysis
Technical Achievements#
| Feature | Details |
|---|---|
| 6 SQL Queries | Deployments, incidents, correlation, risky PRs, team, health |
| 2 Cross-Source JOINs | GitHub × Sentry, Slack users × channels |
| 1 Custom Source Spec | payment-api.yaml for internal microservice |
| AI Analysis | Gemini-powered root cause + fix suggestions |
| NL-to-SQL | Ask questions in English, get Coral SQL results |
| 2 Interfaces | CLI (zero deps) + Web Dashboard (Flask) |
| Security | Fernet symmetric encryption at rest |
| Docker + CI | Production-ready packaging + GitHub Actions |
Try It#
git clone https://github.com/khadirullah/devops-incident-investigator
cd devops-incident-investigator
pip install flask google-generativeai cryptography
python3 app.py
# Open http://localhost:5000 — works instantly with demo data!Future Work#
- Direct Release Correlation: Correlate Sentry releases directly to GitHub commits using commit SHAs.
- More Sources: Add Grafana and Kubernetes log sources to the SQL engine.
- Automated Postmortems: Use the AI layer to generate and publish full incident postmortems automatically.
Built with Coral for the Pirates of the Coral-bean hackathon by WeMakeDevs.
Follow the journey: khadirullah.com | GitHub